What Is a Value Stream Map (VSM)?
When you walk onto a company's production floor you see machines running, people moving and products being carried from one point to another. But it is hard to tell how much of this movement really creates "value" the customer is willing to pay for and how much is "waste" hidden inside the system.
What Is a Value Stream Map (VSM)?
When you walk onto a company’s production floor you see machines running, people moving and products being carried from one point to another. But it is hard to tell how much of this movement really creates “value” the customer is willing to pay for and how much is “waste” hidden inside the system. This is where Value Stream Mapping (VSM)comes in: the most powerful lean manufacturing tool that makes the invisible visible.
As Gembapartner, we cover in full detail this strategic analysis method that lets you see your processes as a whole.
What Does the Value Stream Concept Mean?
The value stream is the sum of all processes a product or service goes through, from the raw material stage until it reaches the customer. This concept covers not only physical production but also the flow of information.
A value stream has two basic components:
-
Value-Adding Activities: Operations that change the form, function or quality of the product in line with the customer’s demand (e.g. painting or assembling a part).
-
Non-Value-Adding Activities (Waste): Operations that consume resources but add no value to the product in the customer’s eyes (e.g. waiting, transport, excess inventory).
What Is a Value Stream Map (VSM) Used For?
VSM is a method of depicting the current state of a process with standard symbols on paper or in a digital environment. But it is not just a flow chart. The basic function of VSM is to show the “big picture” by revealing the connections between processes and the flow of information.
Using VSM, companies can;
-
See production cycle times (Lead Time),
-
Pinpoint bottlenecks in the process,
-
Understand disconnects between information flow and material flow,
-
Create a roadmap for improvement activities (Kaizen).
What Problems Does VSM Reveal?
During a VSM study, the following problems that usually go unnoticed in the intensity of daily operations come to light:
-
Excess Inventory: Piles of work-in-process (WIP) and raw material accumulating between processes.
-
Unnecessary Waiting: Dead time between the end of one operation and the start of another.
-
Information Confusion: Production orders not matching actual needs on the shop floor or wrong planning.
-
Unbalanced Lines: Rhythm disruption caused by one machine running too fast and another too slow.
How Is a Value Stream Map Created?
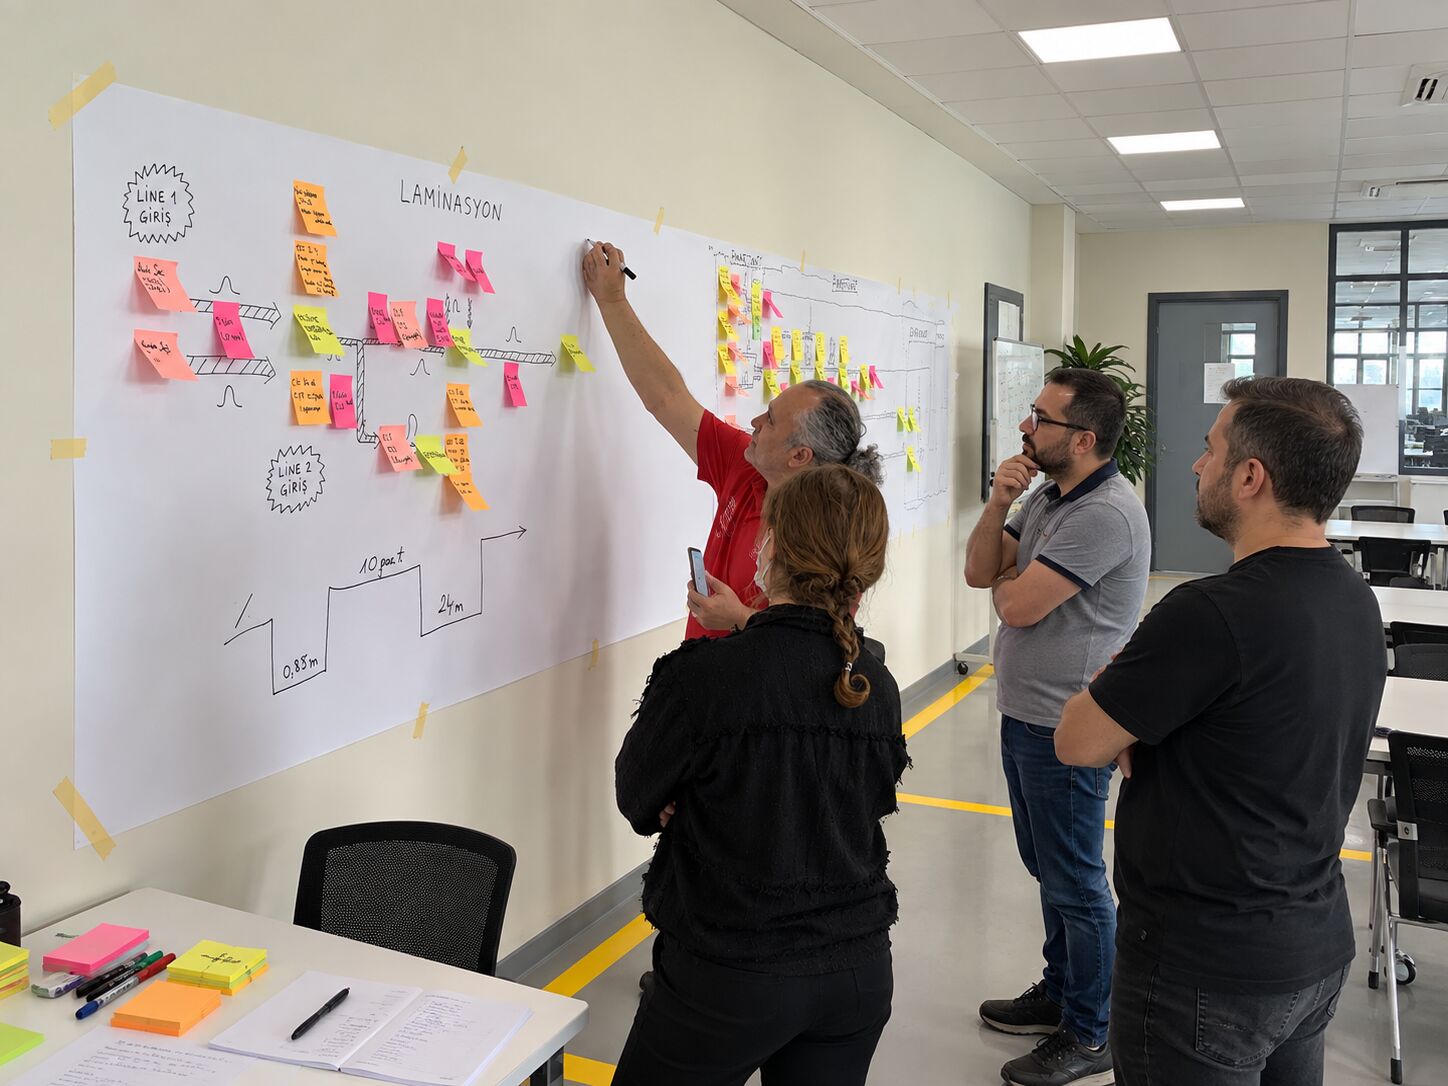
Creating a VSM is not a job that can be done at a desk. You must go to the “Gemba” (where the work is done) and collect data by observing it yourself.
Defining the Process Steps
The first step is to draw all the main boxes from the start of the process (supplier) to the end (customer) for a selected product family. Each operation step is represented by a process box.
Adding Time and Performance Data
A “data box” is added under each process box. The following critical data go here:
-
C/T (Cycle Time): The time to complete a part at that station.
-
C/O (Changeover Time): Model changeover time.
-
Uptime: The ratio of machine running time.
-
Number of Personnel: Number of operators working at that station.
-
EPEI (Every Part Every Interval): Production frequency.
The Difference Between Current State and Future State VSM
A VSM study is a two-stage journey:
-
Current State Map: The answer to “What are we doing now?” It is a photograph of the existing system with all its errors, waste and inefficiency.
-
Future State Map: The answer to “How should the system be?” It is the ideal scenario where waste is cleared, flow is achieved and a pull system (Kanban) is designed.
The difference between the two maps forms the list of the company’s improvement projects.
VSM Symbols and Basic Notations
VSM has a universal language. This way, lean experts anywhere in the world can read the same map:
-
Factory Symbol: Represents the customer and supplier.
-
Data Box: Contains process parameters.
-
Triangle Symbol: Shows inventory and stock quantity.
-
Truck Symbol: Represents transport and shipping.
-
Glasses Symbol: Denotes Gemba observation (Go and See).
How Is VSM Related to Lean Manufacturing?
VSM is like the “compass” of lean manufacturing. VSM decides where you will apply tools such as 5S, SMED, Kaizen or Jidoka. If you do random Kaizen without a VSM analysis, you end up making “local optimizations” that do not benefit the system as a whole. VSM ensures all improvement energy is focused on the weakest link (bottleneck) of the system.
In Which Sectors Is the Value Stream Map Used?
Although the automotive industry is the first to come to mind with VSM, its field of application is very broad:
-
Manufacturing: Machining, textiles, food, defense industry.
-
Services: Banking processes, insurance claims management, call centers.
-
Healthcare: Analysis of the processes from patient admission to discharge.
-
Software: The flow from receiving a request to deploying the code (DevOps VSM).
Common Mistakes in Value Stream Mapping Studies
The obstacles to a successful VSM study are generally these:
-
Drawing the Map in the Office: The real data is on the shop floor. A map drawn from estimates is misleading.
-
Complexity: Making the map too detailed (micro-processes) and getting lost in it.
-
Leaving It Static: Drawing the map, hanging it on the wall and never looking at it again. VSM is a living document.
-
Not Designing the Future State: Drawing the current state without setting improvement targets is just a waste of time.
What Is Gained After a VSM Study?
As a result of a successfully completed VSM and future state implementation:
-
Lead Time Reduction: Up to 50% improvement in the time it takes for the product to reach the customer.
-
Inventory Reduction: A significant drop in the amount of parts waiting in warehouses.
-
Productivity Increase: Reduction in labor and time cost per unit of product.
-
Visual Management: The whole team speaks the same language about goals and disruptions.
How Is Process Improvement Started with a Value Stream Map?
To start a VSM study you must first select a “Product Family.” Choosing the best-selling product, the one that receives the most complaints or the one that is hardest to produce is the best start. Then you should set up a cross-functional team (Production, Planning, Quality, Maintenance), go to the shop floor and collect the first data.
Who Is the Value Stream Map (VSM) Suitable For?
VSM is suitable for companies of every size that want not just to “manage” their work but also to “improve” it. Especially;
-
Those experiencing complexity in production processes,
-
Those who cannot meet customer delivery times,
-
Those complaining about high inventory costs,
-
It is indispensable for those who want to simplify their processes before digital transformation (Industry 4.0).
Value stream mapping is a pair of glasses that increases an organization’s ability to “see.” When you put on these glasses, waste can no longer hide and the road to excellence becomes clear.