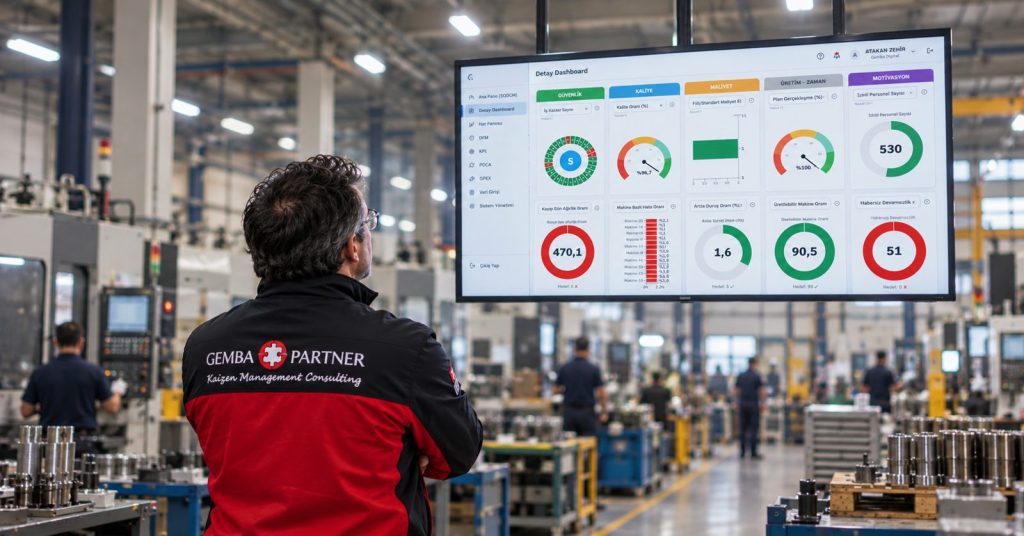
Lean Manufacturing Indicators: Are You Really Lean?
Is your operation really lean? 10 key lean manufacturing indicators including cycle time, WIP, FTT, takt, OEE and lean maturity.
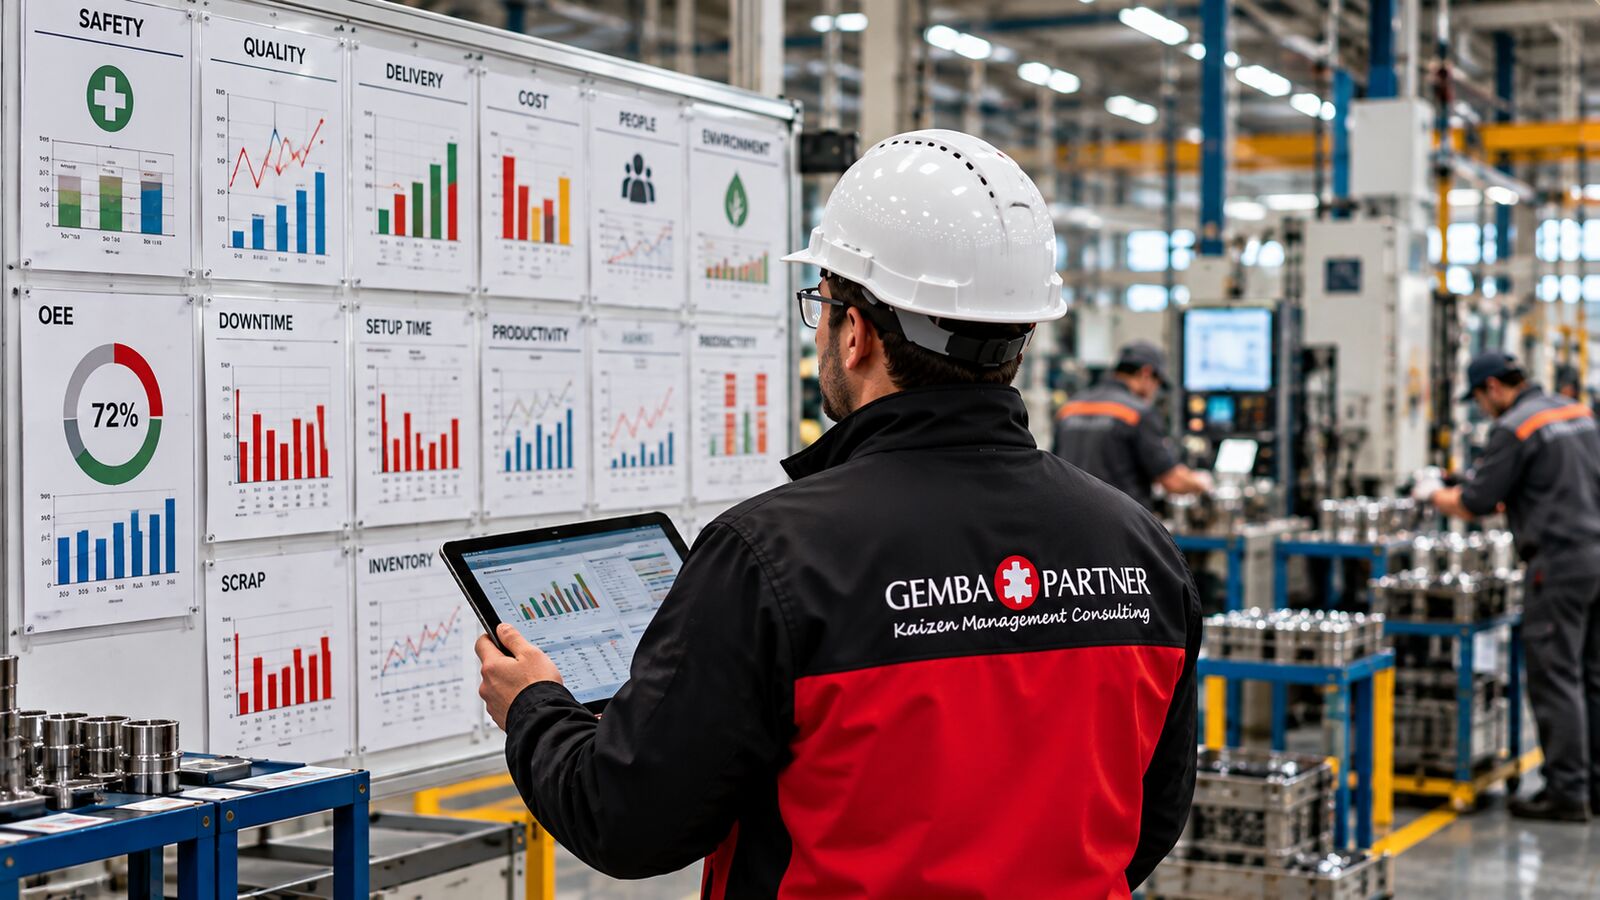
In the operations you manage, can you truly feel the impact of lean? Can you measure and report your organization’s lean maturity level with concrete data? Or do you believe you have become lean only by looking at the indicators on visual boards?
On the lean manufacturing journey, the principle “you can’t manage what you can’t measure” is especially important. 5S, kanban, kaizen and value stream work turn into results only when monitored with the right indicators. In this article, we cover the 10 key indicators that will help you evaluate lean manufacturing performance, why each one matters and how it can be tracked.
Metrics That Measure Success in Lean Manufacturing
Pursuing efficiency is at the core of lean principles. However, understanding whether your operations are truly lean requires more than superficial observation. By understanding the indicators below and their results, you can make informed decisions to optimize your operations for maximum efficiency and competitiveness, and keep your operational excellence roadmap up to date.
1. Cycle Time and Lead Time
In lean operations, your cycle time and the product’s lead time to the customer (including the total time from supplier to customer) must improve. If you start with the right data in a value stream mapping (VSM) study on a pilot product group, you can see the impact of the techniques you introduce on these parameters.
2. Work-in-Process (WIP) Inventory
If your changeover times are long, your intermediate stock levels will also be high. Regularly evaluate the amount of unfinished work in production. A decrease in WIP speeds up production flow, and faster flow shortens lead time.
3. Ratio of Value-Added to Non-Value-Added Work
Separate activities that directly add value to the final product or service from those that do not. Minimizing waste and non-value-added activities increases both efficiency and the value on the product.
4. First Time Through (FTT)
The time until the first approved product and the quantity produced are scrap, in other words waste. Track the percentage of products that meet quality standards the first time (First Time Through). A high FTT rate improves quality and reduces repeated labor problems, which we call rework.
5. Takt Time Alignment
Track when customers want to receive products. Working with a Just-in-Time focus means being able to manage customer delivery times correctly. There is not just one customer; therefore, knowing the takt time per product means knowing the sales rate of each product. Takt time is found by dividing available working time by customer demand. Using takt time, you can align all operational processes to customer demand, increase your inventory turnover and optimize resource utilization.
6. Visual Management and 5S
You can measure the order and cleanliness of your work area with visual management and 5S activities. By setting target scores and ideal areas in 5S audits, you can continuously improve 5S performance.
7. Kaizen and Suggestion System
Kaizen is an important activity for development and shop floor motivation. With metrics such as the number of kaizens and problem solving per person, you can continuously monitor the effectiveness of your kaizen system. If you also set a metric for the gains achieved from kaizen, you make improvements concrete.
8. Unplanned Downtime and OEE
First, you should be able to measure each of the categories that make up downtime separately: changeover (set-up), breakdowns, minor stops and speed losses. If you have an OEE (Overall Equipment Effectiveness) parameter that everyone measures with the same understanding, you can also track the impact of your improvement efforts from progress in OEE results. OEE is calculated as the product of availability, performance and quality rates.
Improvements in changeover times should be tracked with a separate metric and encouraged with continuously updated targets. In this regard, TPM (Total Productive Maintenance) practices offer a strong framework.
9. Productivity
By improving cycle time or making in-line labor more flexible, you can increase output per man-hour. With this parameter, you can also track the results produced by lean systems in terms of cost.
10. Operational Excellence Level
By periodically tracking your maturity level during system setup, you can see where the system is stuck and which areas need development. Make your criteria tougher over time in lean maturity assessments; this way, each assessment gives you a better perspective. An improvement culture encourages continuous efficiency gains.
Management should be able to see the impact of every system you set up and every activity you carry out on cost, quality, operational efficiency and employee motivation. Tracking this impact visually makes transformation projects meaningful for stakeholders and supports cultural transformation. To make this tracking easier with digital boards, see our Gemba Digital solutions.
On the lean transformation journey, these indicators are not merely a reporting tool; they also show which lean manufacturing technique works where. Improvement in cycle time and WIP confirms flow work, improvement in FTT confirms quality work, and improvement in OEE confirms maintenance and changeover work. Properly tracked indicators also provide a concrete basis for your cost reduction goals.
Conclusion
A transformation program built on these indicators contributes to sustainable operational excellence; it allows your organization to thrive in competitive markets, deliver value to its customers, minimize waste and maximize efficiency.
By requesting lean manufacturing and lean management maturity analysis support from Gemba Partner experts, you can build the roadmap to operational excellence together. For details, see our lean manufacturing consulting page or get in touch with us.